Metrics Collection in Self-Hosted Deployments
Overview
Sublime uses DataDog for application performance monitoring, system health monitoring, and operational insights. The DataDog agent is embedded within Sublime's Docker images and can be dynamically enabled or disabled by customers through their Sublime dashboard. The information extracted from your Sublime instance is built with privacy and compliance considerations top of mind. This information is critical to Sublime's ability to provide proactive and reactive support for your deployment. Additionally, we use this diagnostic information to plan for future capacity needs as well as tune your instance to maximize message processing performance.
Customer Control
Customers can control DataDog telemetry through their Sublime Dashboard:
- "Admin" > "Account" > "Usage data" > "Send errors and system health information"
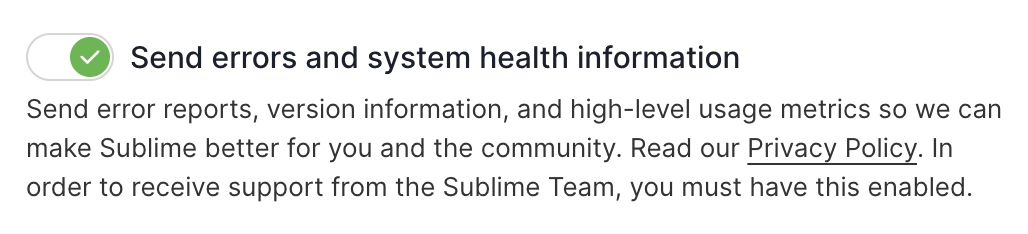
- When disabled, no telemetry data is sent to DataDog
- The DataDog agent is only activated when customers explicitly enable monitoring
Required settingsDataDog telemetry collection is mandatory for Enterprise deployments and optional for Core deployments.
Types of Data Collected
1. Application Logs
- Service logs: Application logs from core services (mantis, bora, nugget, inline_monitor)
- DataDog agent logs: Internal agent logging for debugging
- Format: Structured JSON logs with timestamps and severity levels
2. Application Performance Monitoring (APM)
- Traces: HTTP request traces, task execution spans, database queries
- Service performance: Response times, error rates, throughput
- Request traces: API endpoint performance and dependencies
- Background job execution: Task processing times and success rates
- Database interactions: Query performance and connection metrics
3. Custom Business Metrics
The application sends various operational metrics including, but not necessarily limited to:
Message Processing Metrics:
- Message processing latency and duration
- Email analysis timing (spam detection, content analysis)
- Queue processing metrics
- SMTP session metrics (connections, data size, success/failure rates)
System Health Metrics:
- Heartbeat metrics for service availability
- Cache hit/miss ratios and performance
- Active mailbox counts
- Processing failure rates
- Memory and CPU usage patterns
Security and Detection Metrics:
- Attack score verdicts
- Authentication events
- Rule execution performance and results
4. Infrastructure Metrics
- Container metrics: Docker container resource usage
- Host metrics: CPU, memory, disk, network usage
- Process metrics: Running processes and resource consumption
- System performance: Load averages, file system usage
5. Application Profiling Data
- CPU profiles: Application CPU usage patterns
- Memory profiles: Heap usage and allocation patterns
- Goroutine profiles: Concurrency and thread usage
- Block profiles: Lock contention and blocking operations
- Metrics profiles: Runtime metrics collection
6. Events and Alerts
- Startup/shutdown events: Service lifecycle events
- Error events: Application errors and exceptions with stack traces
- Configuration changes: System configuration updates
- Deployment events: Version updates and releases
Data Enrichment and Tagging
All telemetry data is tagged with:
- Environment information: staging, production, development
- Service identification: specific Sublime service names
- Version information: Release version and Git commit SHA
- Infrastructure details:
- Cloud provider (AWS, Azure)
- Region and availability zone
- Container and host identifiers
- Organization context: Customer organization IDs (hashed/anonymized)
Data Transmission and Security
Transmission Method
- Protocol: HTTPS to DataDog intake endpoints
- Compression: Logs and metrics are compressed before transmission
- Batching: Data is batched for efficient transmission
- Authentication: Uses DataDog API keys managed by Sublime
Security Measures
- TLS encryption: All data transmitted over TLS 1.2+
- Access controls: DataDog API keys are securely managed
Data Processing and Retention
DataDog Processing
- Log processing: Automatic parsing and indexing of log data
- Metric aggregation: Statistical aggregation over time windows
- Trace sampling: Intelligent sampling to manage data volume
- Alert generation: Automated alerts based on metric thresholds
Data Retention
- Logs: Logs are retained for a year.
- Metrics: Long-term retention with data aggregation
- Traces: Short-term retention (typically 7-15 days)
- Events: Medium-term retention for audit purposes
Data Exclusions and Privacy
What is NOT Collected
- Email content: Actual email message bodies and email metadata are not sent to DataDog
- User credentials: Passwords, API keys, and authentication tokens
- Personal data: Customer email addresses or personal information
- File contents: Attachment contents or file data
- Encryption keys: Security certificates and private keys
Data Sanitization
- Automatic removal of sensitive patterns from logs
- Sanitization of emails and JWTs
- IP address masking and anonymization
- URL parameter sanitization
- Database query parameter scrubbing
- We regularly audit code to ensure fields do not contain PII and they are not logged or added to traces or spans
Azure ARM Deployment Considerations
For Azure ARM deployments specifically:
- Azure metadata collection: Subscription ID, resource group, region information
- Identity management: We only use Azure-managed identities
Updated 30 days ago